What's a Walk Worth?
Summary
Moneyball. What is it and why is it important? Many people have seen the film starring Brad Pitt or even read the book by Michael Lewis. Put very simply, the idea is that getting more people on base by any means increases a teams chance of scoring runs, and ultimately winning the game. This idea intuitively makes sense, however, the application challenged baseball norms at the time. At the time, teams were obsessed with putting the ball in play and making flashy, big plays. The ‘Moneyball’ concept does not care how the runners get on. Basehits, walks, bunts, and even hit by pitches count!
14 years after publication (2003), let’s see what a walk is worth and how it relates to winning.
Data Support
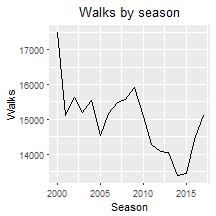
To begin, let’s take a look at walk totals by season for the entire league.

These results were somewhat surprising to me. However, I think the time period of 2005 – 2009 is worth exploring. The early 2000’s were plagued by the steroid era in baseball, offense was up overall and pitching was down since every fucking player put needles in their buttholes (still love Sammy Sosa though).
Every year from 2005 – 2009 saw an increase in walks. Does this make sense? What could have happened in 2004? oh yeah, the GOAT Theo Epstein and boy wonder, sabermetric genius won the World Series in 2004 with the Red Sox (suck it Cardinals). Baseball is such a copycat league, it makes sense other teams would try to copy a similar model to those Red Sox.
I know what you’re thinking, “okay, sure, but what about 2010 – 2014! Players forgot what a walk was!” This is explained by better pitching. The graph below summarizes league starters ERA by season. It almost beautifully correlates with the walk totals. These years were just dominated by great pitching.

Next, notice that in the walk totals and ERA, that there is an uptick in 2015. If you follow baseball, you’d be aware that there is a story here regarding increased homeruns. See the chart below for home run totals by year.

Two things should stand out:
- This chart also trends well with ERA and Walks
- Massive explosion in homeruns in 2015-present
Again, as similar to the early 2000’s, with more home runs/offense come more walks. From a baseball point of view this makes sense. If the ball is flying out of the park, pitchers will be more careful and walk more guys. When this happens, more guys are on base, and even if the left on base % stays constant at 75%, more runners will score, because more runners are on base. Thus, the increase in ERA.
Hopefully by now, you understand why walks are important. Walks relate strongly to a teams offense. Let’s investigate this correlation a little more.
Walks and wins
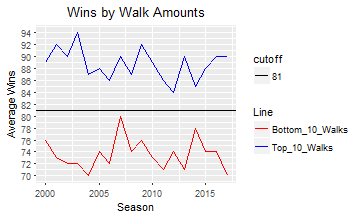
I’d like to start with the following graph. If this doesn’t convince you that walks matter, literally nothing will.

For each of the 18 seasons, I grabbed the top 10 teams in walks (blue), bottom 10 teams in walks (red) and plotted the average win totals for those teams compared to the league average win total (81). In multiple seasons, this difference is worth upwards of 20 wins. For a game dubbed the ‘game of inches’ and a league where teams miss the playoffs by 1 or 2 games this difference is huge. It’s pretty obvious, get more baserunners via the walk and win more games.
Now that the importance of walks is incredibly clear, just how important is a given walk to winning a game? By comparing the ratio of walks to wins for each of the last 18 seasons, a single walk can be worth as much as 0.18 wins. Next time you want to yell at your favorite player for taking his walks instead of swinging for the fences on 3-0 you better think twice.


Comments
Post a Comment